BIC Process Design
Understand & Transform
Supercharge your business operations with the most intuitive AI-powered BPM software.
It seems that you come from a German speaking country. Here you can change the language
EnglishProducts by GBTEC
BIC Process Design
Understand & Transform
BIC Process Design
Understand & Transform
Supercharge your business operations with the most intuitive AI-powered BPM software.

BIC EAM
Structure & Streamline
BIC EAM
Structure & Streamline
Reduce IT costs and accelerate your IT transformation with our intelligent EAM solution.

BIC Process Execution
Automate & Orchestrate
BIC Process Execution
Automate & Orchestrate
Redefine the way you work with record-breaking workflow automation.

BIC GRC
Secure & Comply
BIC GRC
Secure & Comply
Explore our comprehensive GRC platform tailored to meet your needs.

Apromore Process Mining
Reveal & Accelerate
Apromore Process Mining from Salesforce
Reveal & Accelerate
Unlock crucial insights from hidden process data and swiftly eliminate weak points.

Use Case
Understand & Transform
BIC Process Design
Process Excellence
Optimize your workflows for maximum performance and efficiency.
Digital Transformation Projects
Pave the way for your digitization project with a process-driven approach.
Integrated Management System
Align various management systems and leverage synergies.
Quality Management
Set new standards for excellence in quality management.
SAP S/4HANA Transformation
Successfully navigate SAP S/4HANA migration or implementation projects.
Structure and Streamline
BIC EAM
Business Enterprise Architecture
Align your business strategy and IT landscape in perfect harmony.
Business Capability Mapping
Gain clear insights to seamlessly align strategy, processes, and IT.
IT Landscape Transformation
Transform your IT landscape to agilely navigate the digital transformation.
IT Rationalization
Optimize your IT landscape for maximum performance and efficiency.
Technology Risk Management
Protect your business from risks and foster stability for innovation.
Automate & Orchestrate
BIC Process Execution
HR Workflow Automation
Shape the future of Human Resources with automated processes.
IT Workflow Automation
Relieve your IT department from time-consuming routine tasks with automated workflows.
Approval Workflow Automation
Automate your approval workflows and accelerate decision-making.
Forms Automation
Simplify data collection and processing with automated forms.
Secure & Comply
BIC GRC
ESG Management
Enhance social responsibility and environmental impact while adhering to governance standards.
Outsourcing Management
Keep the security of your outsourced processes in mind at all times.
Risk Simulation
Proactively simulate risks and be prepared for potential crisis situations.
Compliance Management
Monitor compliance, mitigate risks, and quickly adapt to new requirements.
IT and Cyber Security
Manage IT risks, comply with regulations, and protect your most valuable company assets.
MaRisk
Benefit from comprehensive risk management to fulfill BaFin's requirements fully.
NIS-2
Achieve NIS2 compliance with integrated IT risk management and automated workflows.
Industries
Automotive
Gain new insights for excellent processes and an improved customer experience.
Education & Universities
Spot improvement potentials in your administrative and teaching processes effortlessly.
Energy & Utilities
Uncover bottlenecks and potential savings in your processes systematically.
Finance & Insurance
Create secure and reliable processes in a highly regulated environment.
Healthcare
Improve efficiency through optimized, digital processes in healthcare.
Logistics
Optimize supply chains and uncover potential savings in your supply chain processes.
Manufacturing
Exploit the potential in your procurement, production, and transportation processes.
Pharma & Chemistry
Enhance your processes and ensure compliance with regulatory standards.
Public
Accelerate digitalization and pinpoint areas for process improvement.
Real Estate & Construction
Unlock potential savings in marketing and administration of your construction projects.
Other Industries
Unlock significant cost savings while simultaneously boosting process efficiency.
All Resources
Webinars & Events
Whitepaper
Wiki
Process Management
Accelerate growth. Optimize your business processes for peak performance.
Enterprise Architecture
Align systems, drive efficiency. Transform your enterprise for the future.
Process Automation
Work smarter, not harder. Let automation enhance productivity and drive your success.
Process Mining
Shine a light on your processes. Discover inefficiencies and power your progress.
Governance, Risk & Compliance
Protect what matters. Strengthen your operations with structure and security.
Blog
Success Stories
Product Information
You want to analyze the flow of your processes in detail? With Apromore Process Mining you create the ideal basis for this! The tool's performance mining capabilities fundamentally simplify your analyses and visually highlight error-prone processes, long lead times and bottlenecks. This way you gain groundbreaking insights about your processes!

Automatic process recognition is followed by so-called performance mining, which enables numerous statistics and comparisons of the existing business processes. The term performance stands for the efficiency, effectiveness or success of an activity or the entire process. As input, Apromore Process Mining again uses the logs of your stored event logs. You can then view the performance of the various metrics as a chart or table in a dashboard. Alternatively, the statistics can be overlaid directly on top of an automatically determined process model. For example, by using color-coded elements to highlight bottlenecks or high effort activities, process performance with Apromore Process Mining allows you to gain a deeper understanding of your underlying processes and helps you answer questions such as "Where are bottlenecks?" and "Which process step takes longer? Is this related to the bottlenecks?" to be answered accurately in subsequent analyses.
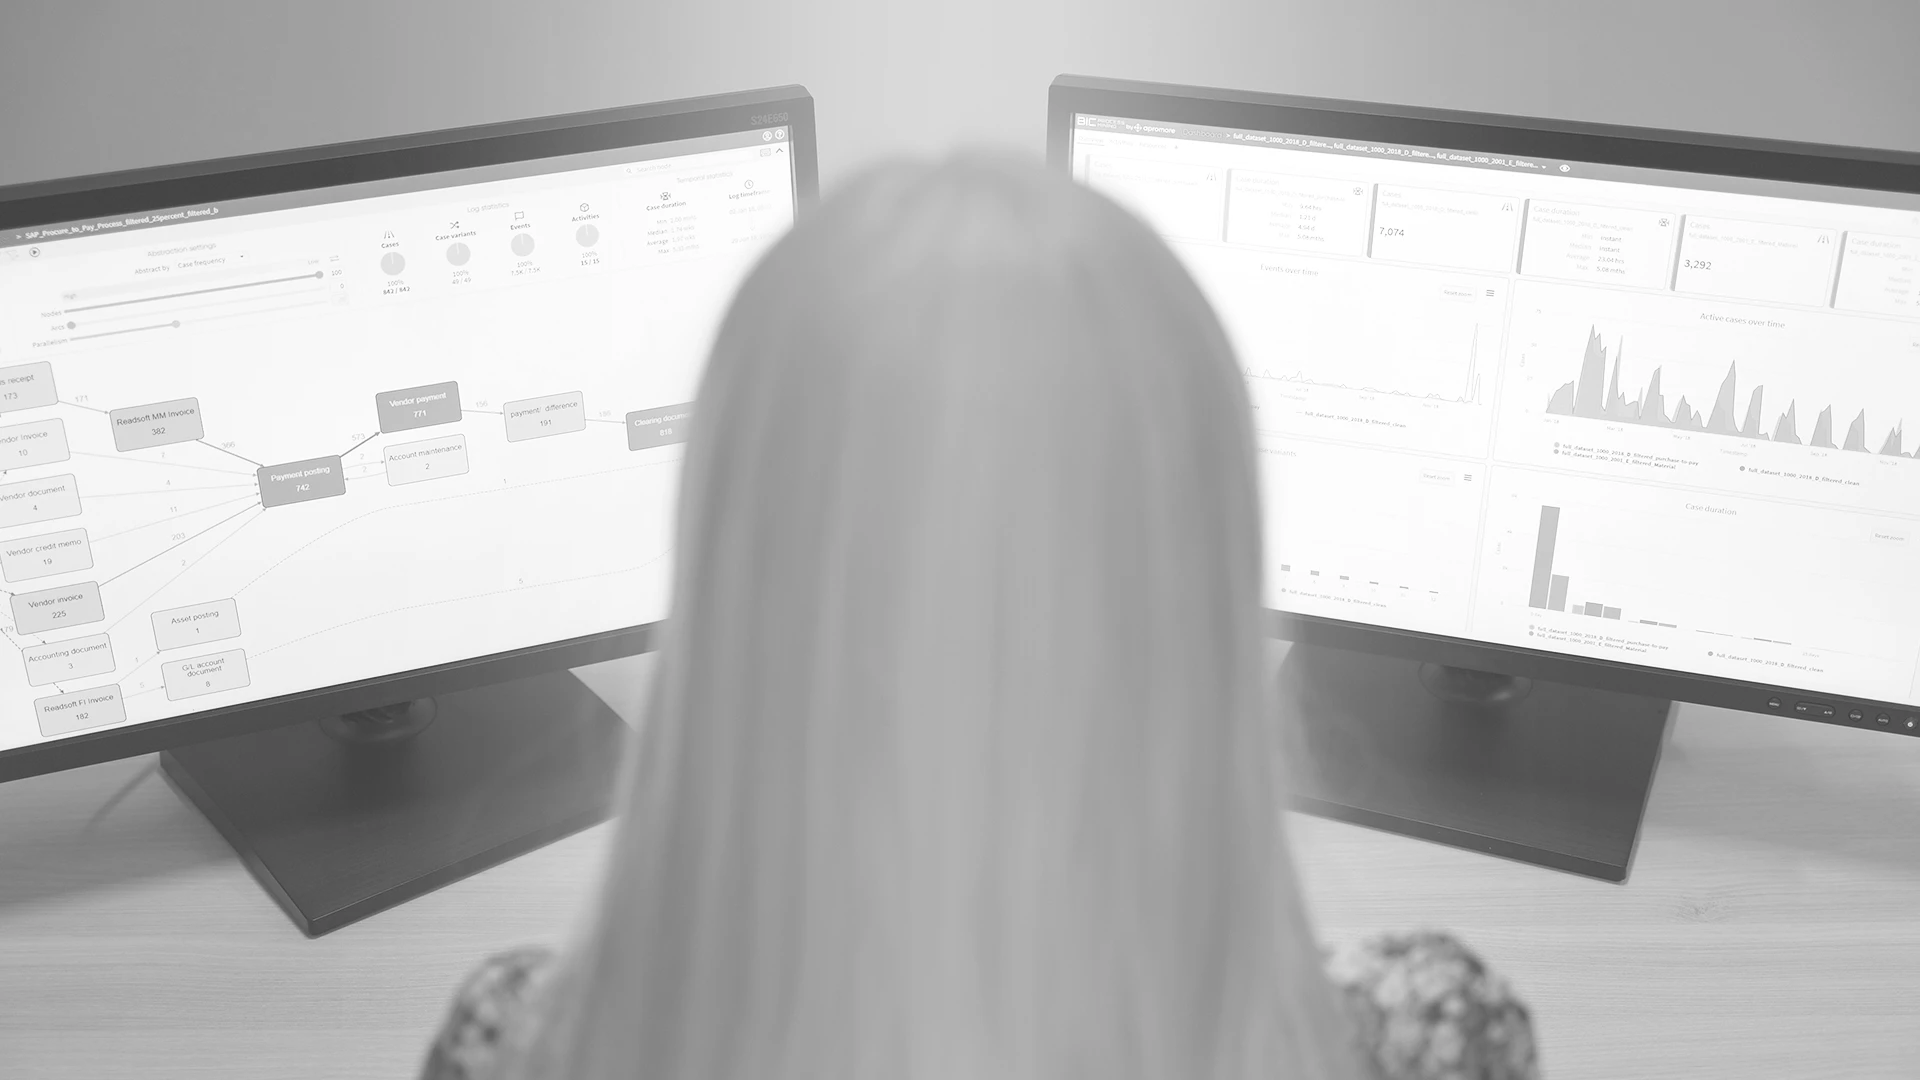
Get to the bottom of your processes: The dashboard of Apromore Process Mining shows you the most important information in a graphically easy-to-understand way. From process variants to case duration to displays related to the individual activities or resources involved - the dashboard offers you a variety of display options. Find out how long your processes take, if there are any outliers, how long each process step takes on average, how long a resource works on a process, and which resources might be stuck. If you want to look at an area in more detail, you can easily zoom into a view to analyze just one month's time, for example. Custom dashboards let you filter the data that's relevant to you and add benchmarks and metrics to highlight the data that deviates from your standards.


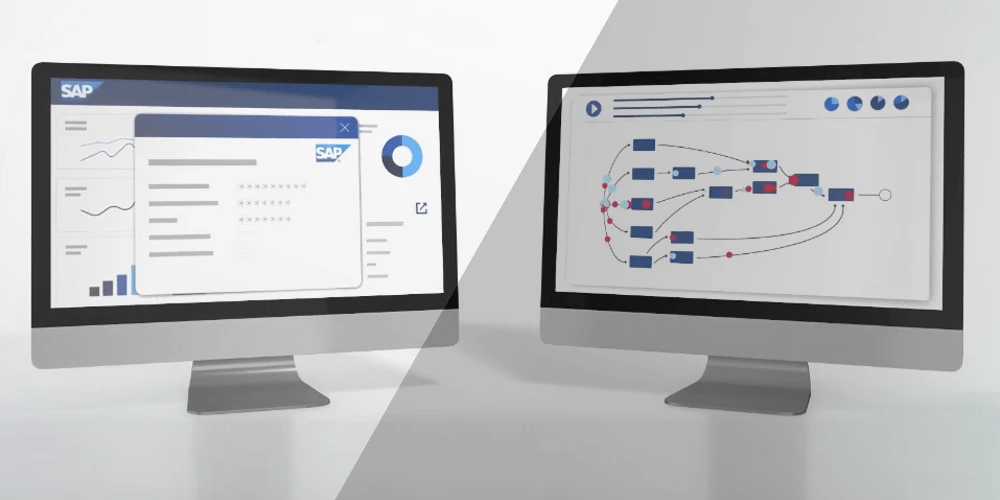
View the run-through of individual process cases as an interactive process animation to understand the dynamics behind your processes. The process model, automatically taken from the event log, is displayed in the Log Animation plugin along with the individual cases of the event log. Each case is represented as a point. With a click on the play button you start the animation and the cases or points move realistically through the process. This allows you to follow in detail how the individual cases move through the process model and where bottlenecks occur. To fully understand the dynamics of the process model, a time slider lets you fast-forward, rewind, adjust the speed of the animation, or stop. If you select multiple event logs, they are colored differently and make a direct comparison possible.
Manufacturing companies sometimes have highly complex end-to-end processes that make the detection of inefficiencies almost impossible. Apromore Process Mining's automatic process recognition provides a remedy: It enables complete transparency and thus offers the optimal basis for further analyses. With the help of performance mining, bottlenecks, waiting times and inefficiencies can be tracked down by the push of a button. Thanks to performance mining, a meat producer in Asia-Pacific was able to uncover and analyze process variants and make optimal adjustments to them.

With process performance in Apromore Process Mining, you discover bottlenecks, rework, waiting times and process loops, and reveal previously hidden inefficiencies in the entire process flow.
The benefits of performance mining with Apromore Process Mining:
Because you can only optimize the processes you are aware of: with Apromore Process Mining you will discover the true potential of data-based BPM in your organization. Learn more about how process mining can positively influence your business success.
GBTEC Software AG
Gesundheitscampus-Süd 23
44801 Bochum
Germany